


JOIN OUR NEWSLETTER
About This Project
Summary
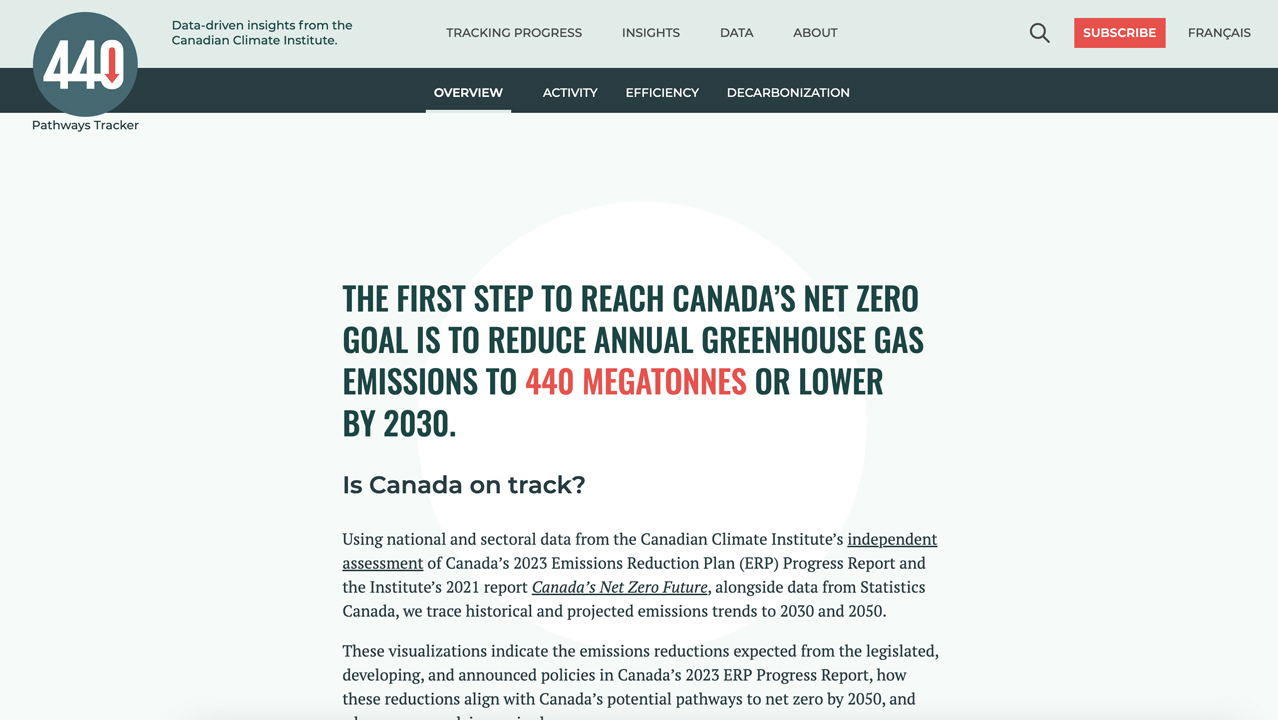
Voilà:, in partnership with the Canadian Climate Institute, created an interactive dashboard to explore greenhouse gas emissions in Canada across sectors and policy scenarios. This unique dashboard is structured around three key factors: "activity," "efficiency," and "decarbonization." A standout feature is its dynamic text, which adjusts to user inputs, offering tailored explanations alongside charts to help readers better understand emissions data and sector-specific progress.
Goals & Objectives
The dashboard aims to increase transparency and accountability for Canada's Emissions Reductions Plan. It highlights progress on climate goals and encourages action by offering free, up-to-date information to drive decisions and foster environmental progress.
Results & Impact
This dashboard was highly successful, with 86,520 visits since launch. It has been presented to key government officials in Energy and Natural Resources and Environment and Climate Change Canada. Updated annually, it continues to support efforts to reduce emissions by 2030.
JOIN THE NEWSLETTER